Module 15: Introduction to Matplotlib
- First read this page then start coding the module.
- Post your Python files to Blackboard under the Module 15 assignment.
Note: Create a text file called module15.txt where you will store your answers to exercise questions. Submit this file on Blackboard along with your code.
Objectives
By the end of this module, you will be able to:
- Understand the purpose and basic structure of Matplotlib.
- Create simple plots using Matplotlib.
- Customize plots with titles, labels, and legends.
What is Matplotlib?
Matplotlib is a Python library for creating visualizations like line charts, bar charts, and scatter plots. Visualizations are a powerful way to understand data and communicate insights effectively.
Importing Matplotlib
You need to import Matplotlib before using it. The most common way is:
import matplotlib.pyplot as plt
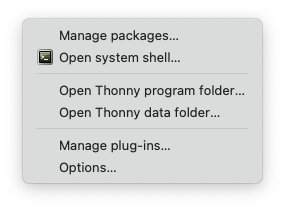
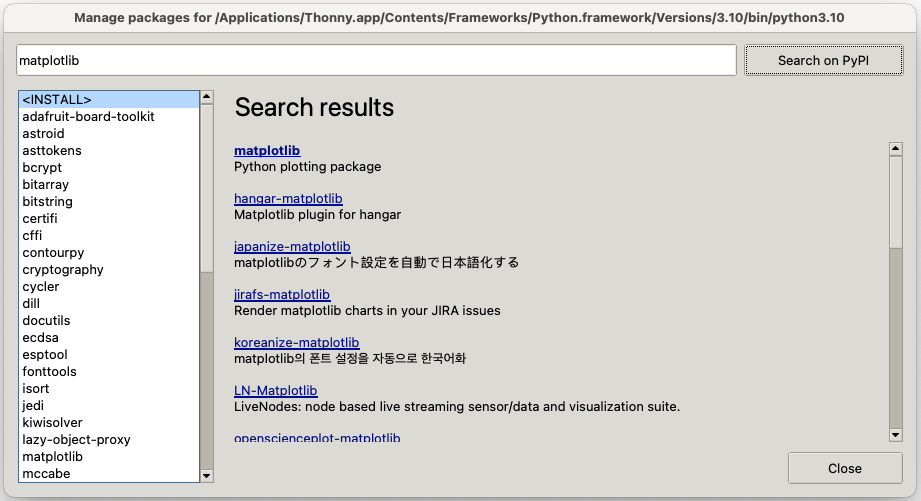
Use Thony to install the Matplotlib library on your machine.
Example: A Simple Line Plot
Consider this program:
import matplotlib.pyplot as plt

# Data
x = [1, 2, 3, 4, 5]
y = [2, 4, 6, 8, 10]

# Create a line plot
plt.plot(x, y)

# Add labels and title
plt.xlabel('X-axis')
plt.ylabel('Y-axis')
plt.title('Simple Line Plot')

# Show the plot
plt.show()
Exercise 1
Create a file simple_plot.py. Type up the above program and run it.
- In
module15.txt, explain howplt.xlabel,plt.ylabel, andplt.titleenhance the plot.
Customizing a Plot
Let’s make a more detailed plot with markers and a legend:
import matplotlib.pyplot as plt

# Data
x = [1, 2, 3, 4, 5]
y1 = [1, 4, 9, 16, 25]  # Squares
y2 = [1, 8, 27, 64, 125]  # Cubes

# Create plots
plt.plot(x, y1, label='Squares', marker='o')
plt.plot(x, y2, label='Cubes', marker='s')

# Add labels, title, and legend
plt.xlabel('X-axis')
plt.ylabel('Y-axis')
plt.title('Squares and Cubes')
plt.legend()

# Show the plot
plt.show()
Exercise 2
In custom_plot.py, type up the above program and run it.
- In
module15.txt, answer:- What does
marker='o'do? - What happens if you remove
plt.legend()?
- What does
Note: For a list of all markers go to: https://matplotlib.org/stable/api/markers_api.html
Bar Charts
You can also create bar charts with Matplotlib:
import matplotlib.pyplot as plt

# Data
categories = ['A', 'B', 'C', 'D']
values = [5, 7, 3, 8]

# Create a bar chart
plt.bar(categories, values)

# Add labels and title
plt.xlabel('Categories')
plt.ylabel('Values')
plt.title('Simple Bar Chart')

# Show the plot
plt.show()
Exercise 3
In bar_chart.py, type up the above program and run it.
- Modify the program to add a second bar chart with values
[6, 4, 5, 9]. - Add a legend to distinguish the two bar charts.
Reading Data from a File and Plotting It
You can read data from a file using Python and use Matplotlib to plot it. Consider this example file called data.txt:
# data.txt
1,2
2,4
3,6
4,8
5,10
The file contains pairs of numbers separated by a comma, where the first number is the x value and the second number is the y value.
Example Program
Here’s how you can read and plot the data from data.txt:
import matplotlib.pyplot as plt

# Initialize lists for x and y values
x = []
y = []

# Read data from file
with open('data.txt', 'r') as file:
    for line in file:
        # Skip comments
        if line.startswith('#'):
            continue

        # Split the line into x and y values
        xi, yi = line.strip().split(',')
        x.append(float(xi))
        y.append(float(yi))

# Plot the data
plt.plot(x, y, marker='o')

# Add labels and title
plt.xlabel('X-axis')
plt.ylabel('Y-axis')
plt.title('Plot from File Data')

# Show the plot
plt.show()
Exercise 4
- Create a File
Create a file nameddata.txtwith the following content:# Sample Data 1,2 2,4 3,9 4,16 5,25 - Write a Program
In a file namedfile_plot.py, write a Python program that:- Reads the data from
data.txt. - Plots the data as a line plot with circular markers.
- Reads the data from
- Modify the File
- Add another dataset (e.g., cubes:
1,1,2,8,3,27,4,64,5,125) todata.txtwith a comment indicating it’s a second dataset. - Modify your program to read and plot both datasets on the same graph with a legend to distinguish them.
- Add another dataset (e.g., cubes: