Flowchart Guide
A flowchart can be used to visually represent an algorithm or program.
What do you think will happen when this flowchart is executed as a Python program?

The code will output “Hello World” in the terminal for the user.
Flowcharts represent code:
-
Flowcharts are used when designing programs.
-
They should be clear and precise, just like your code.
-
Flowcharts are read from top to bottom.
Flowchart Shapes
Here are the five most common shapes used in a flowchart:
- Oval (Terminal symbol)
- Rectangle (Process symbol)
- Arrow (Arrow Symbol)
- Diamond (Decision symbol)
- Parallelogram (Input/Output symbol)
| Symbol | Name | Function |
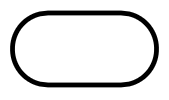 |
Oval | Represents the start or end of a process |
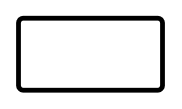 |
Rectangle | Denotes a process or operation step |
| Arrow | Indicates the flow between steps | |
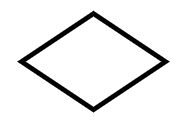 |
Diamond | A point requiring a yes/no decision |
 |
Parallelogram | Used for input or output operations |
Examples
Example 1
Design a program that calculates the sum of two numbers. It reads (takes as input) two numbers and displays the sum.

Now write the program based on the design in the flowchart.
number1 = eval(input("Enter number 1: "))  # Asks users to input number 1
number2 = eval(input("Enter number 2: "))  # Asks users to input number 2

# Calculate the sum of the two numbers
add_result = number1 + number2

# Print the results
print("Sum of two numbers is", add_result)
Example 2
Design a program that determines if a number is even or odd. It reads (takes as input) one number and displays the string ‘Even’ if the number is even, otherwise it displays ‘Odd’ if the number is odd.

Now write the program based on the design in the flowchart.
number = eval(input("Enter a number: "))  # Ask the user to input a number

# Calculate the sum of the two numbers
if number % 2 == 0:
    result = "Even"
else:
    result = "Odd"

# Print the result
print(result)