Thonny IDE Debugger Guide
Thonny is an integrated development environment (IDE) designed for beginners to learn Python. One of its most powerful features is the built-in debugger, which allows you to step through your code and inspect variables to better understand how your program runs. Here’s a guide to using the debugger in Thonny.
Opening the Debugger
To start using the debugger, follow these steps:
- Open your Python file in Thonny.
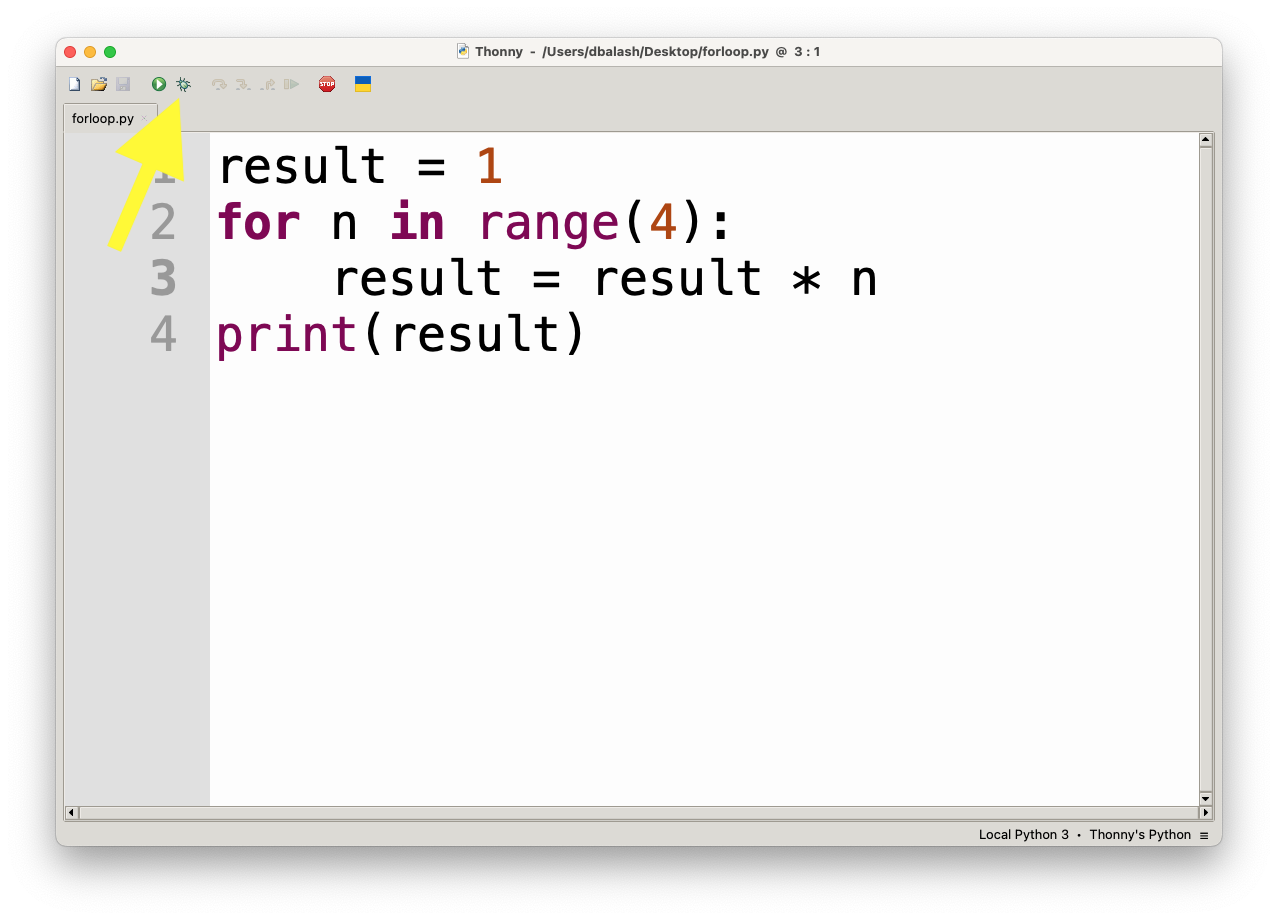
- Click on the Debug button in the toolbar (it looks like a beetle) or press Ctrl+F5 (on Windows/Linux) or Cmd+F5 (on macOS).
- Alternatively, go to the menu bar and select Run > Debug Current Script.
Setting Breakpoints
Breakpoints tell the debugger where to pause the program, allowing you to inspect the state of the program at that point.
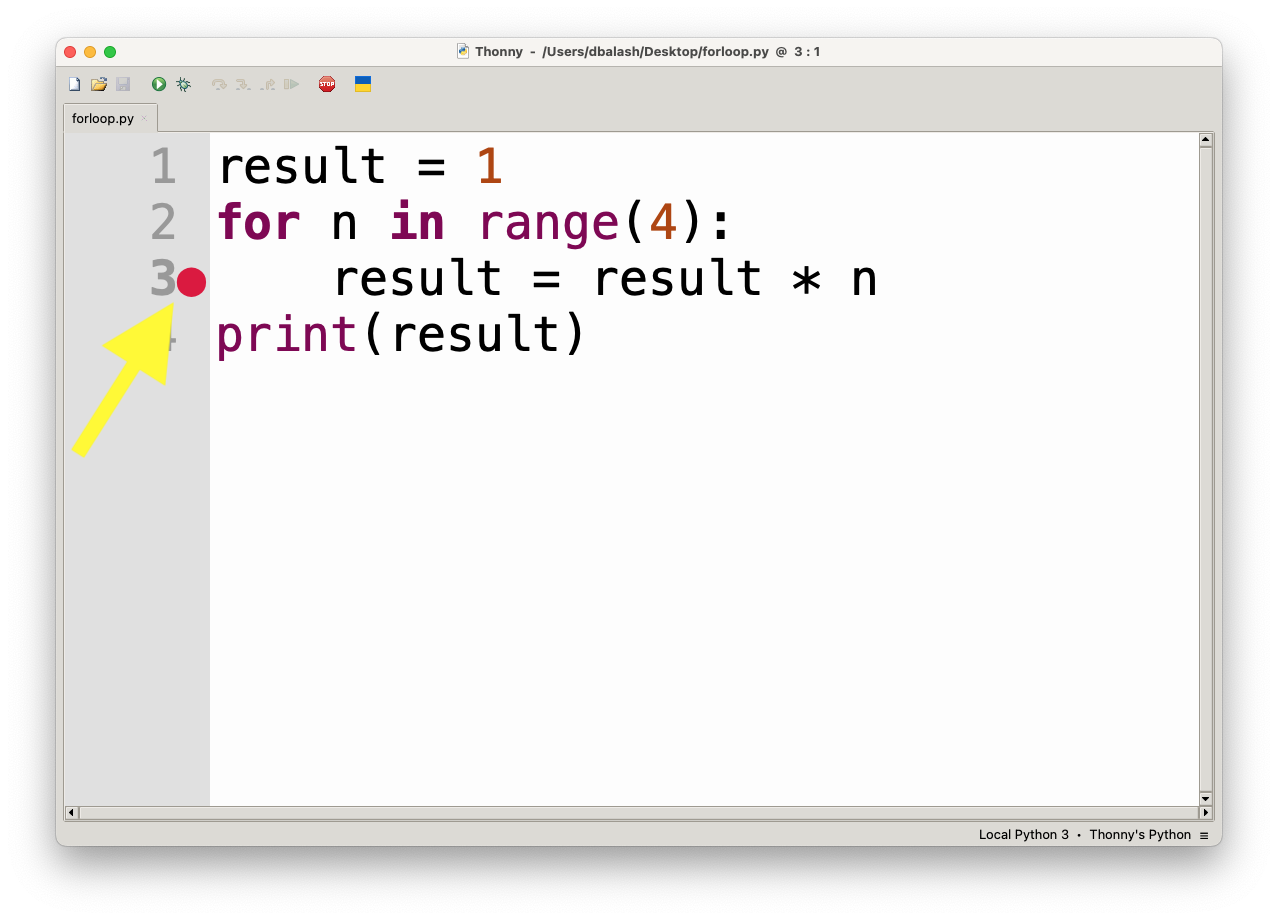
- To set a breakpoint, click to the left of the line number in the code editor where you want the program to pause. A red dot will appear, indicating a breakpoint.
- To remove the breakpoint, click on the red dot again.
Thonny will pause execution when it reaches the line with the breakpoint.
Running in Debug Mode
After setting breakpoints, follow these steps to run your program in debug mode:
- Press Ctrl+F5 (or Cmd+F5 for macOS) or click the beetle icon in the toolbar.
- The program will start running and will pause at the first breakpoint you set.

Stepping Through Code
Once the program is paused, you can control the flow of execution using the following controls:
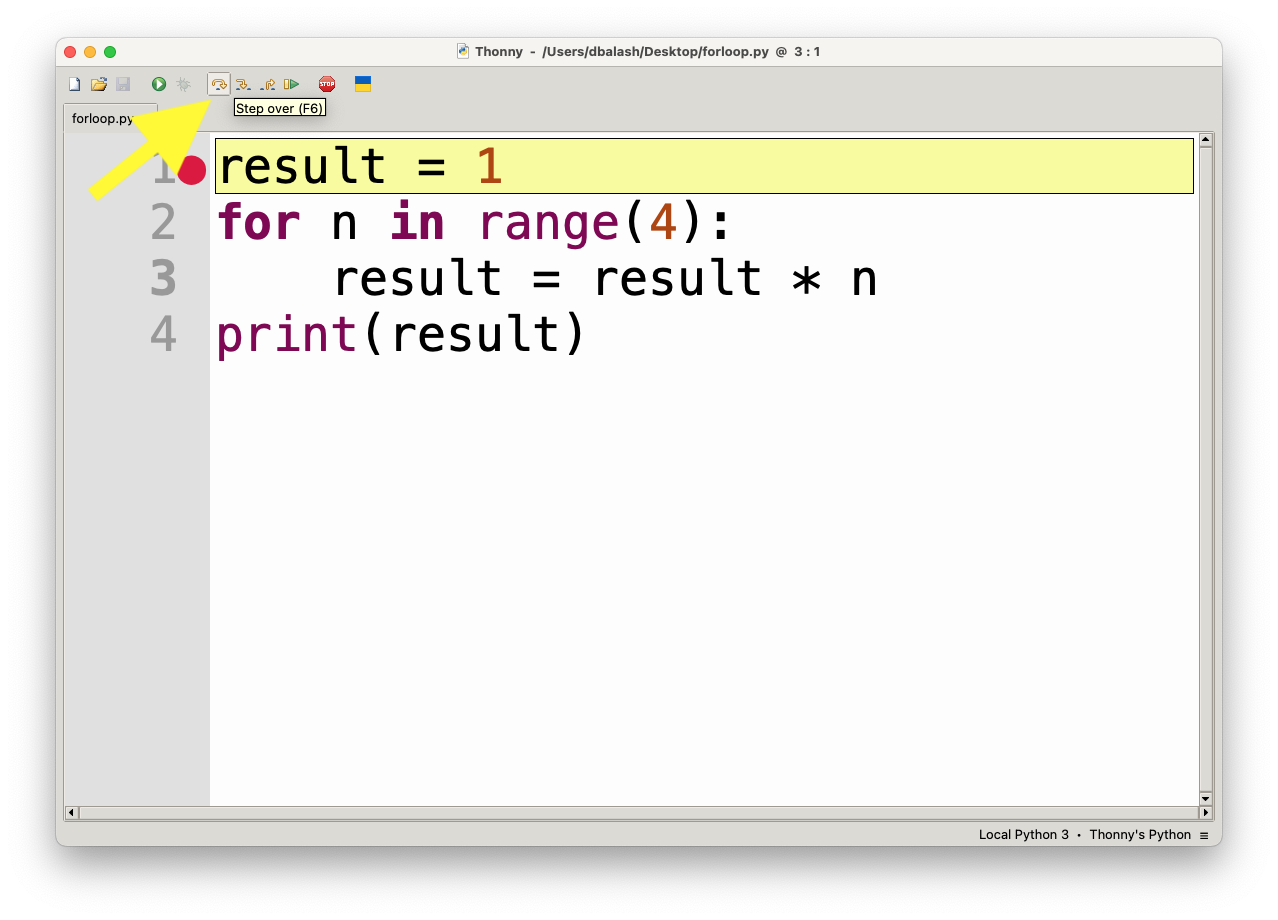
- Step Over (F6): Executes the current line of code. If the current line contains a function call, it will execute the whole function without stepping into it.
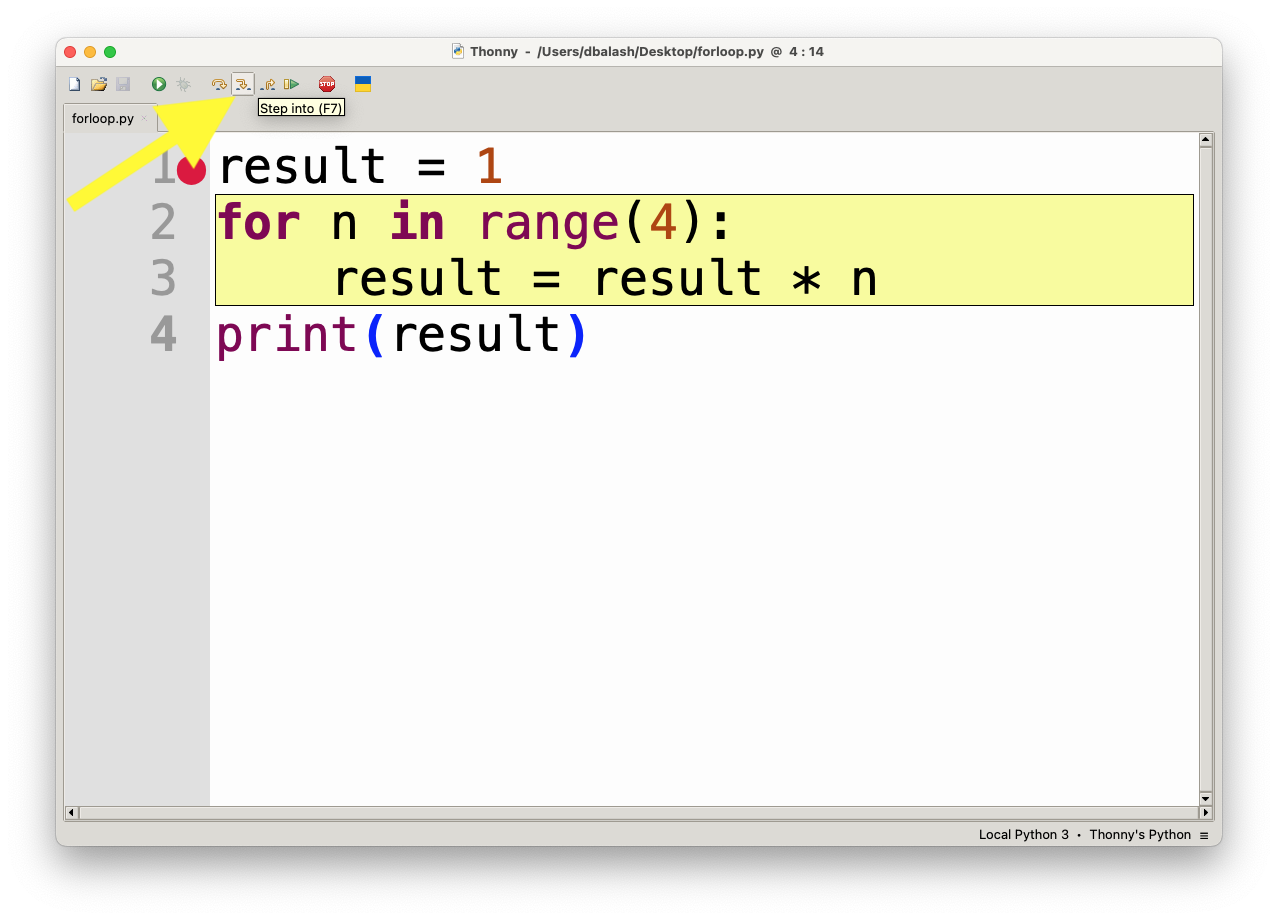
- Step Into (F7): If the current line contains a function call, this will step into the function and allow you to debug it line by line.
- Step Out (Shift+F7): If you are inside a function, this command will execute the rest of the function and bring you back to the calling code.
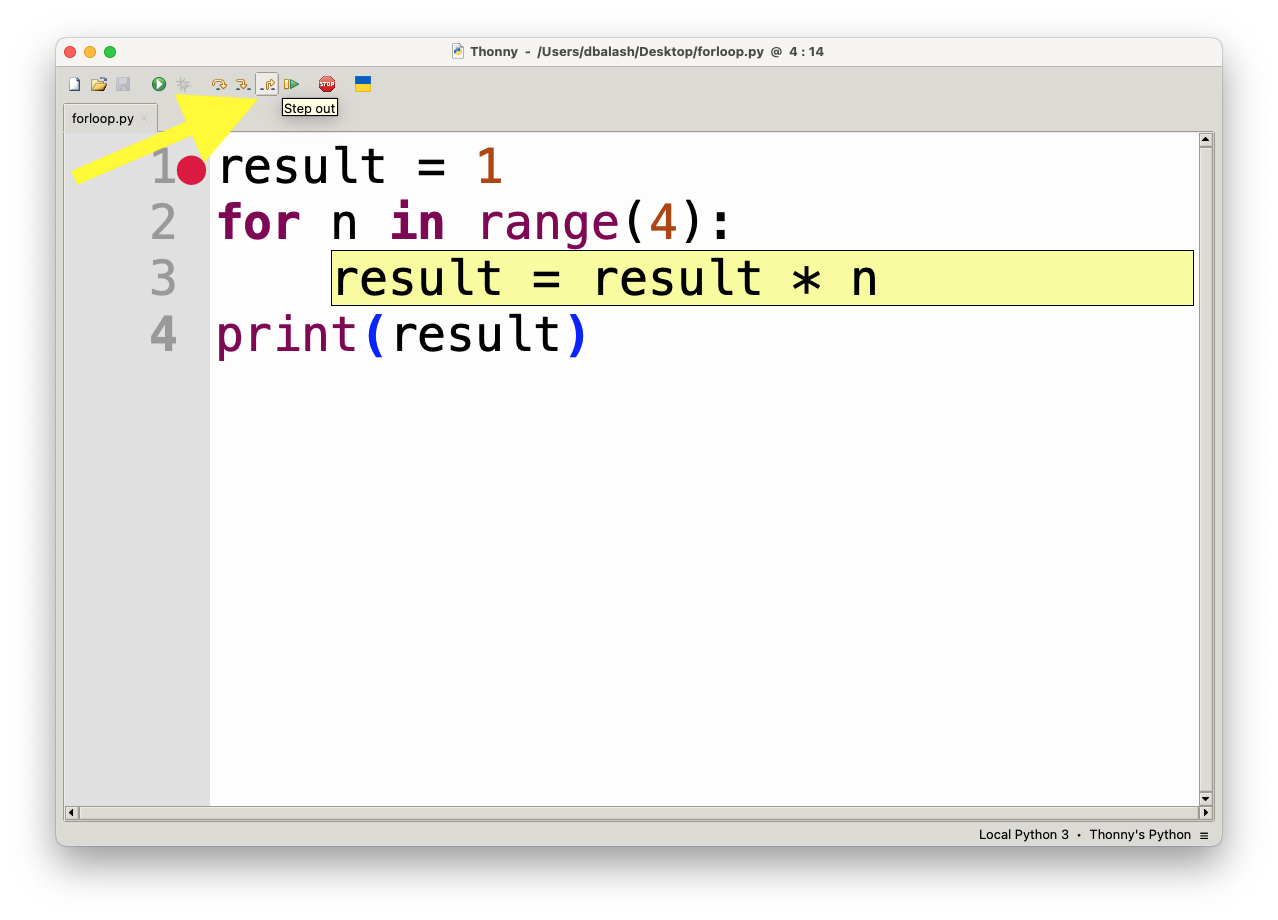
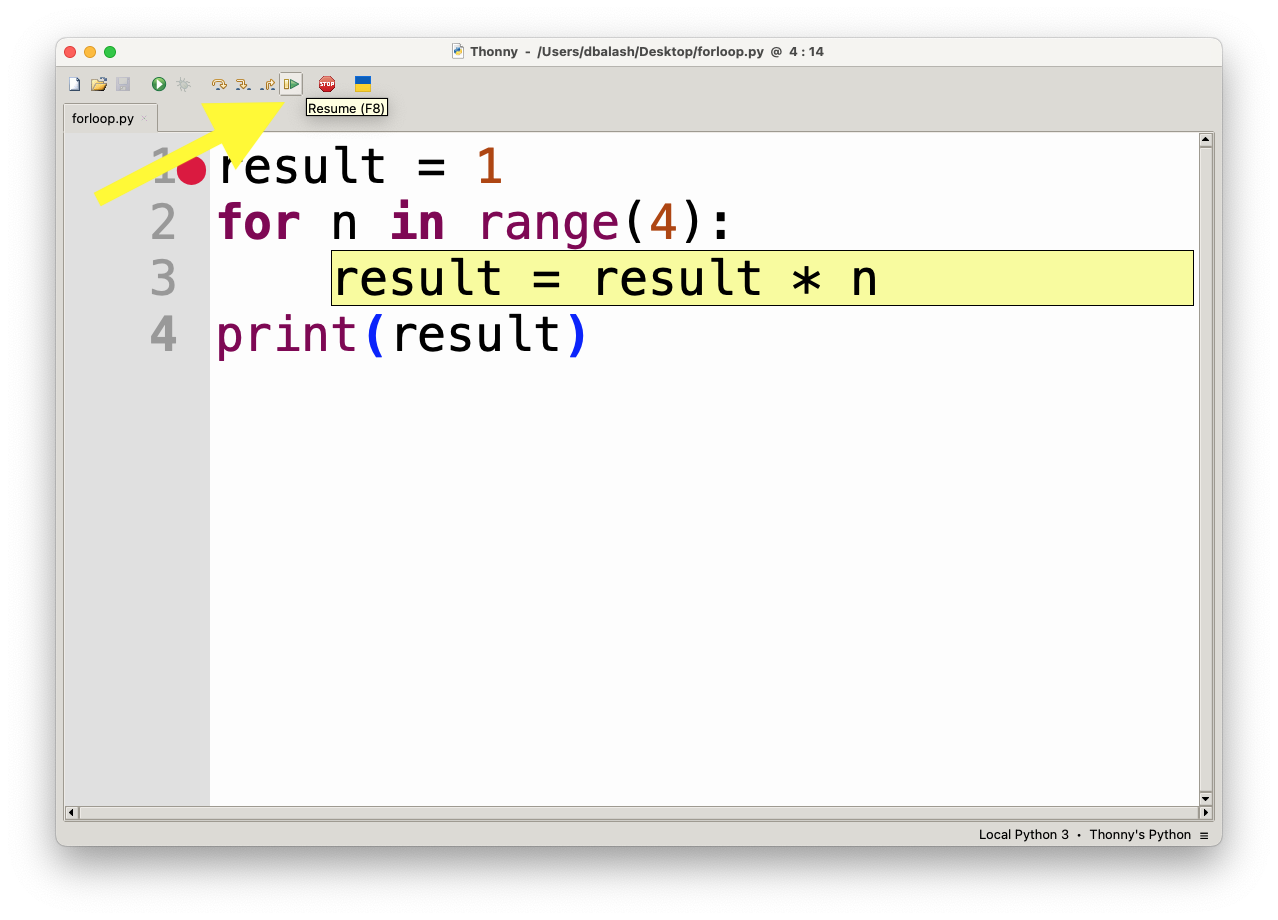
- Continue (F5): This will resume execution until the next breakpoint is reached or the program finishes.
Inspecting Variables
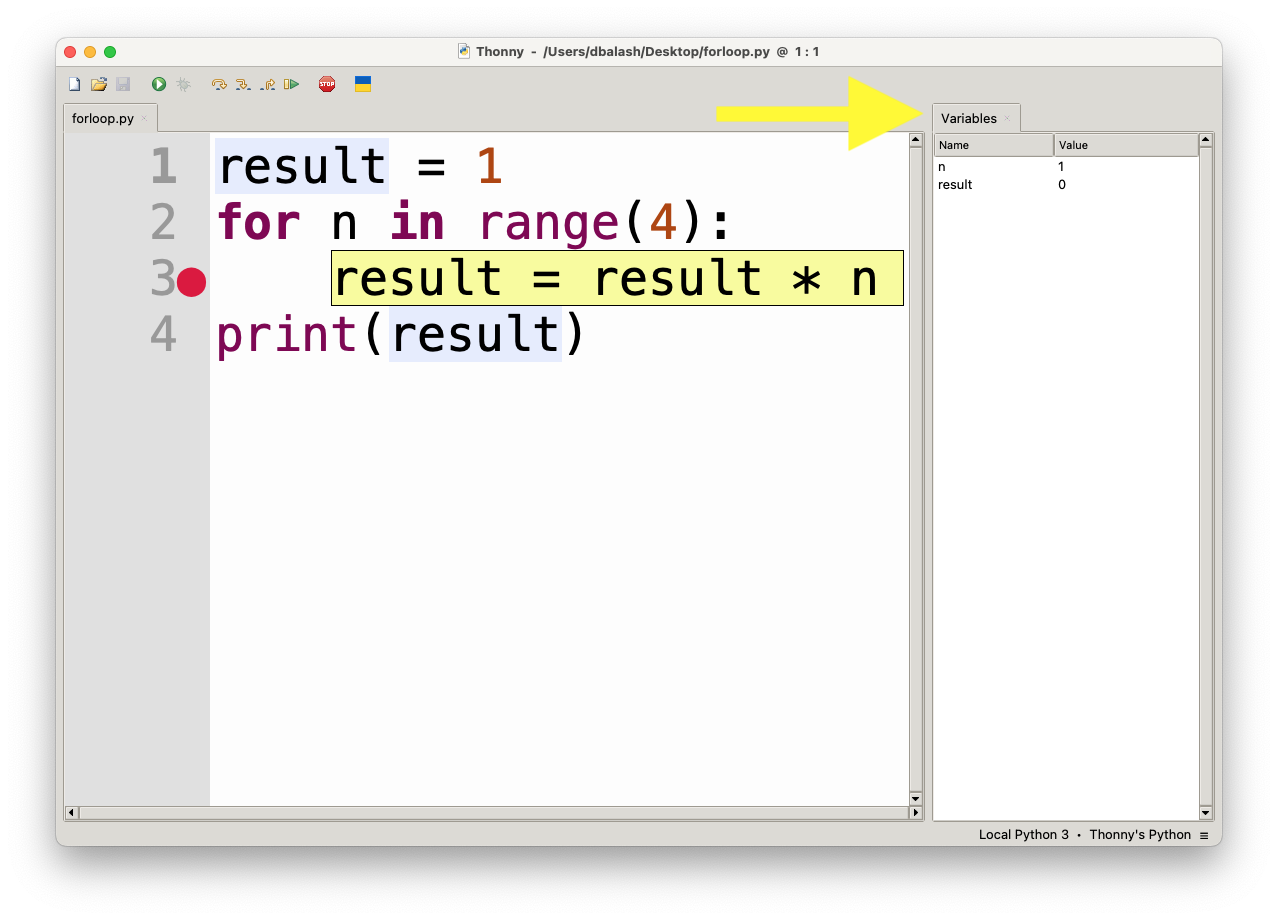
While debugging, Thonny provides a Variables window where you can see the current values of variables.
- The Variables pane is located on the right side of the window. It displays the values of all variables in the current scope (local and global).
- You can track how variables change as you step through your code, which is very helpful for identifying bugs or understanding logic flow.
Call Stack
Thonny also shows the Call Stack, which is located in the lower-right corner of the debugger window.
- The Call Stack window displays the list of function calls that have been made so far, showing you which function the program is currently in and how the program got there.
- This is useful for understanding the flow of a program, especially when working with recursive functions or functions that call other functions.
Debugging Tips
- Step-by-Step Execution: Always start with Step Over to move line by line and observe the code execution, especially when you’re unsure where the problem is.
- Use Breakpoints Wisely: Set breakpoints in areas where you think the problem might occur. This will save you from stepping through every line of code unnecessarily.
- Watch Variables: Pay attention to how variable values change as you step through the code. Incorrect variable values can indicate bugs.
- Check the Call Stack: If you are dealing with function calls, use the call stack to understand how the execution reached a particular point.
Thonny’s debugger is easy to use, yet powerful enough to help you understand your code’s flow, making it an excellent tool for Python learners.